
Interactive visualisation: bringing complex corporate content to life
- Company
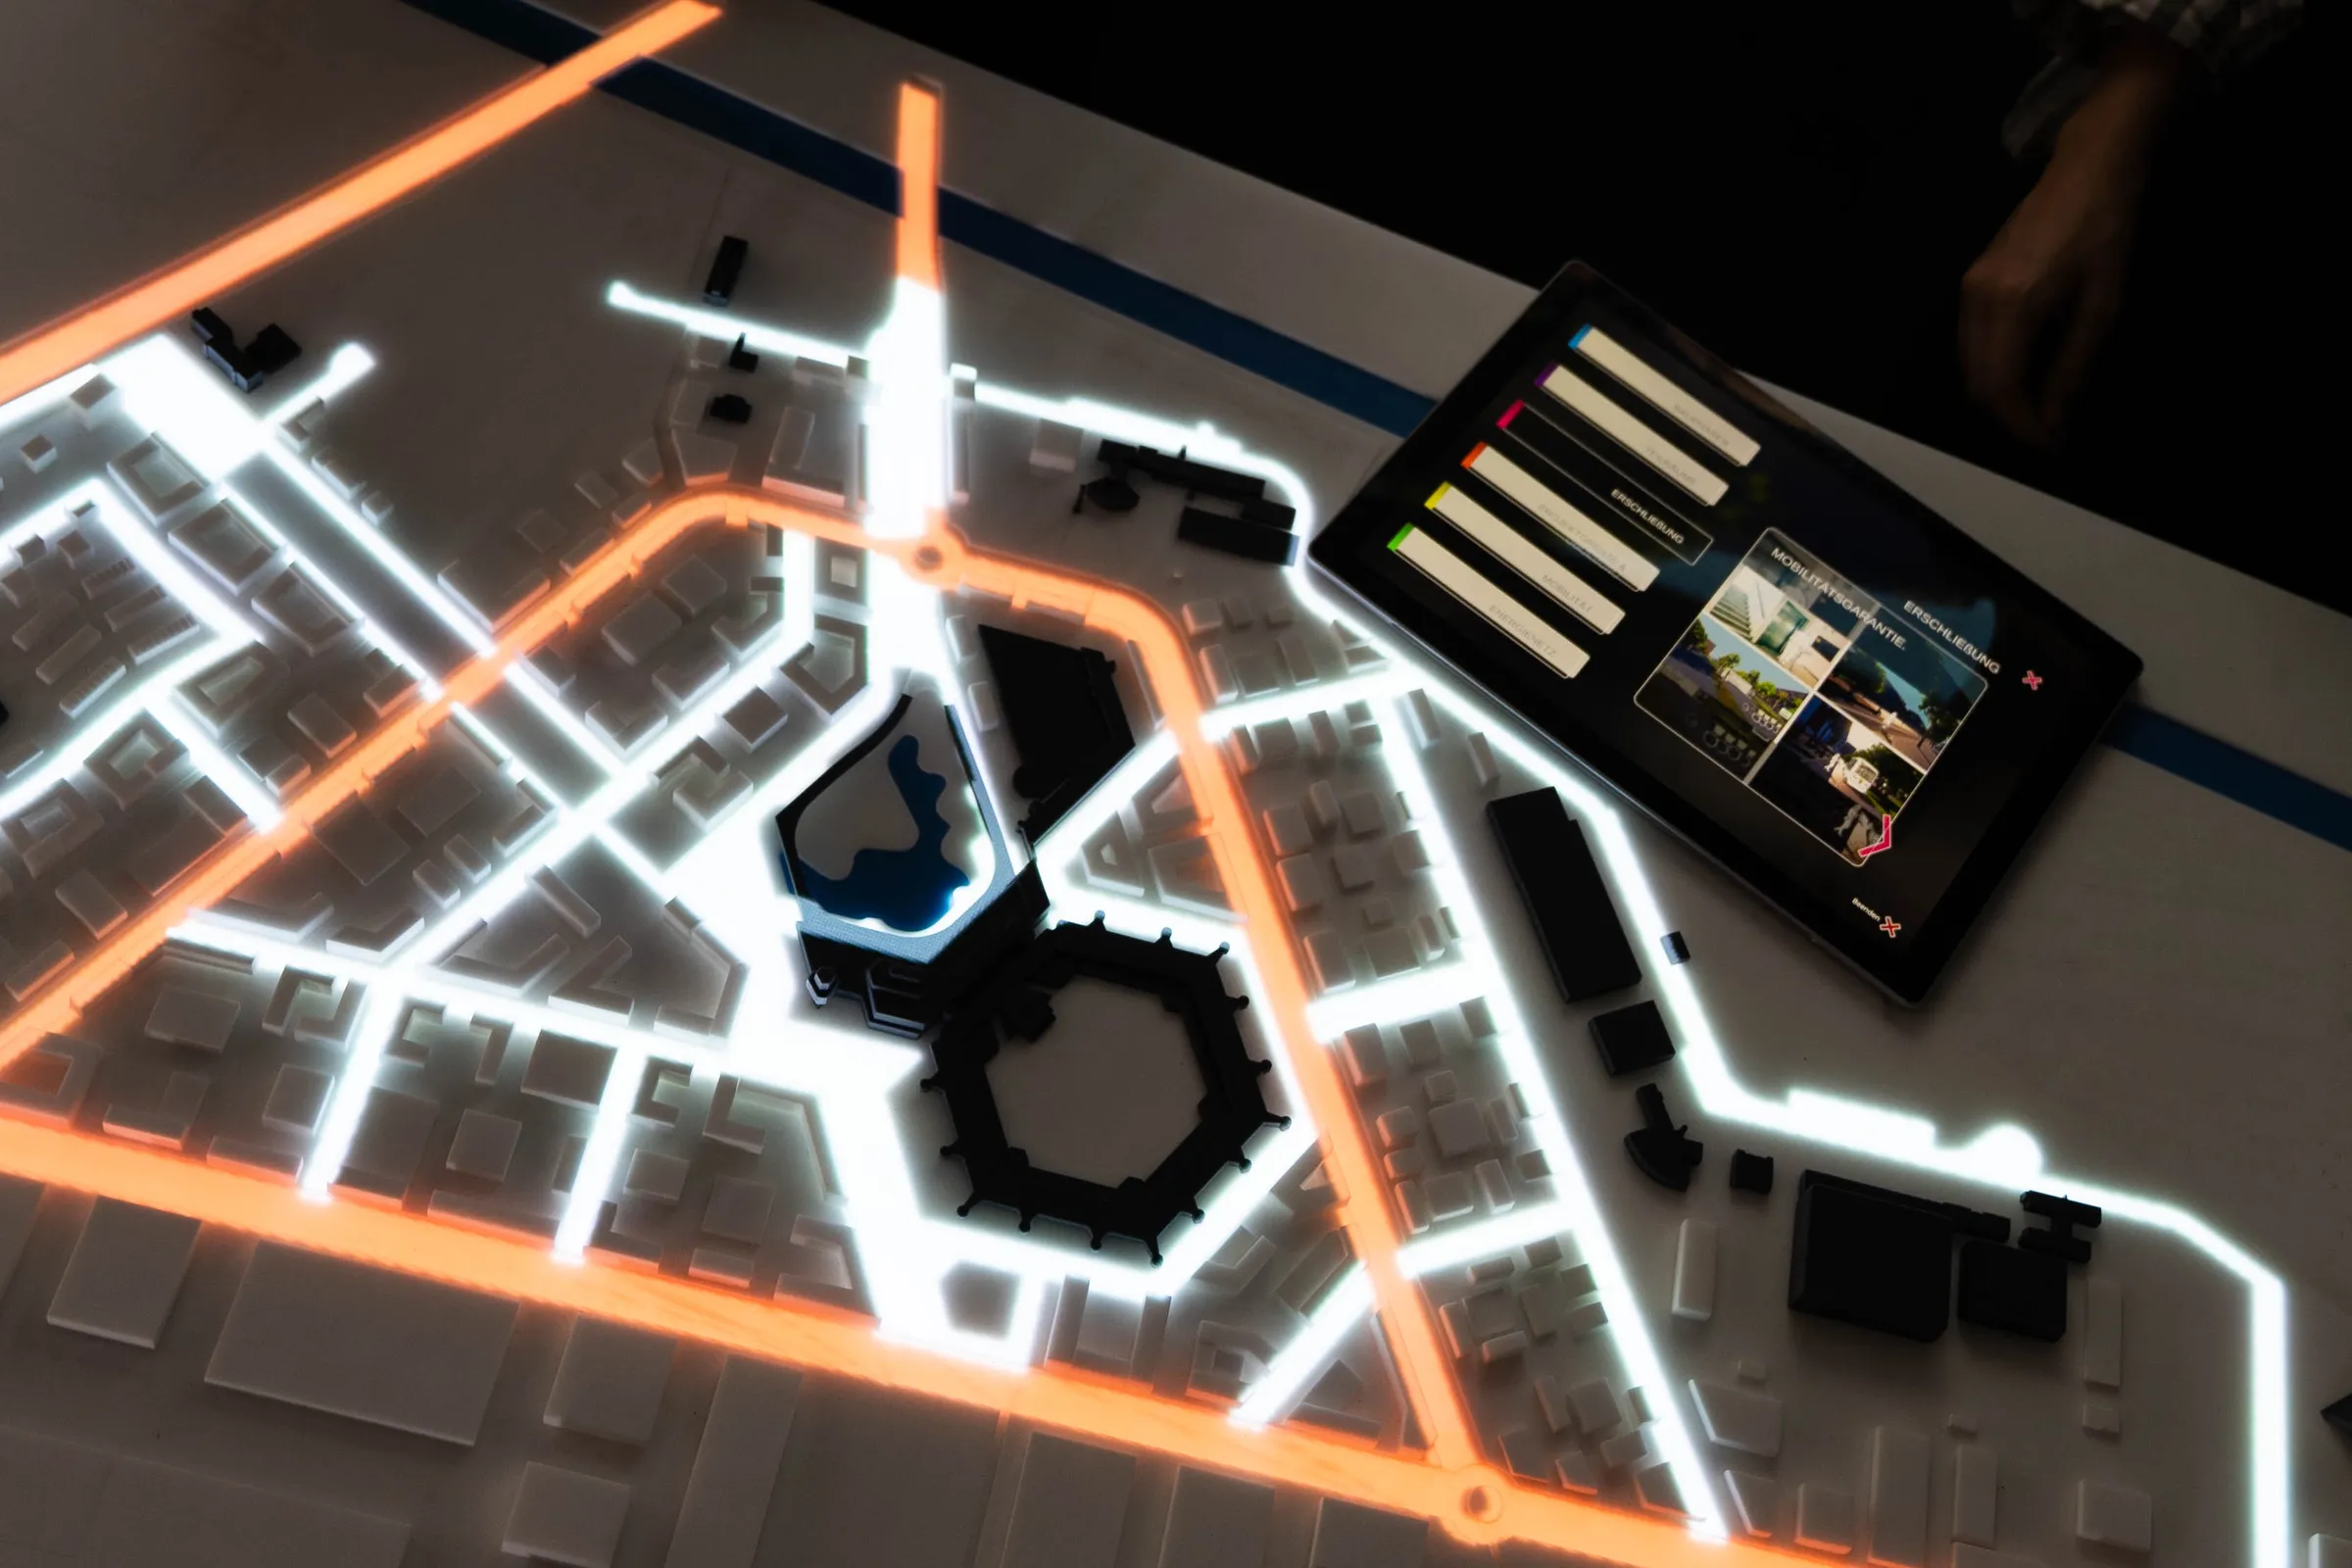
An interactive visualisation transforms information into an experience that responds to people. Visitors touch a surface, move around the room, place an object or adjust parameters – and see immediately what effect their actions have. In this way, products, data and processes are not merely displayed, but made understandable and accessible in a playful way.
Garamantis develops interactive systems for showrooms, exhibitions, visitor centres and sophisticated B2B presentations. We combine storytelling, interface design, bespoke software, real-time 3D graphics, sensor technology, displays and spatial design to create a comprehensive system. We have been working with large-scale interactive projection systems for over 12 years.
What is an interactive visualisation?
An interactive visualisation is a visual representation whose content or perspective changes immediately in response to user input. Unlike a static image or a film that plays out in a linear fashion, the audience plays an active role: they can rotate a 3D model, compare scenarios, view details or control a simulation.
This interaction can take place in various ways:
- using touch and multi-touch
- due to posture or movement
- using hand or arm gestures
- using physical objects and markers
- via controllers, tablets or smartphones
- Sensor readings or external systems
- using virtual reality or augmented reality
The right format does not depend primarily on the technology. What matters is what your target audience is meant to understand, discover or decide.
Static, animated, interactive or immersive?
Format
What’s happening?
Typical benefits
Static visualisation
An image, diagram or rendering depicts a fixed state.
A quick overview and a clear key message
Animation
Content is presented in a predetermined order.
Explaining processes, procedures and changes
Interactive visualisation
Users determine the selection, perspective or sequence.
Exploring, comparing and delving deeper at your own pace
Immersive visualisation
The room itself becomes part of the overall presentation.
Emotional impact, group interaction and lasting memories
Why interactive visualisations are better at conveying complex content
Complexity often arises from having too much information all at once. More often than not, there is no starting point or way in that makes the connections clear. This is precisely where interactive visualisation comes into its own.
5 benefits of interactive learning
- It makes it easy to get started. A clear starting point encourages you to give it a go. Further levels only become available when they are needed.
- It provides immediate feedback. Anyone who changes a parameter can see the effects and changes straight away. This is particularly helpful for simulations, product configurators or networked systems.
- It allows for a personalised level of depth. A board member is interested in different details to a specialist planner. Interactive content can take into account different levels of knowledge, languages and usage scenarios.
- It facilitates discussions.Whether at a large touch-screen table or in front of a media wall, several people can view and edit the same visualisation and discuss it together. A presentation turns into a conversation.
- It combines facts with impact. Data, 3D models, videos, animations and real exhibits can be woven together into a coherent narrative. This ensures that not only does the information stick in the mind, but so does the experience.
Where interactive visualisations really come into their own
Corporate showrooms and visitor centres
An interactive showroom brings products, expertise and future-oriented topics to life in a physical space. Instead of a rigid sequence of presentations, hosts and guests select precisely the content that is relevant to their discussion. Product portfolios, locations, client references, key figures or areas of innovation can be explored in greater depth at short notice. The presentation format is flexible.
B2B offerings that require a detailed explanation stand to benefit from this in particular. For example, large machines do not need to be physically present in the room. Digital or invisible processes can be made visible. Variants can be compared, components can be taken apart, and interrelationships can be demonstrated in real time.
Interactive exhibitions
In interactive exhibitions, visitors decide for themselves how deeply they wish to explore a topic. Multilingualism, varying levels of prior knowledge and different learning speeds can be taken into account directly within the interface.
Interactive maps, digital exhibits, journeys through time, games and immersive spaces combine the imparting of knowledge with curiosity in an exciting way. The exhibit remains the star of the show. Technology opens up new perspectives on it.
Trade fairs and roadshows
At an interactive exhibition stand, a visual display must fulfil two purposes: it must attract attention from a distance and, when viewed up close, facilitate a meaningful conversation. Large-format projections, media walls or moving content ensure impact from a distance. Touch-screen applications and 3D models provide stand staff with a flexible tool for advising visitors and giving presentations.
Product Communication and Training
Interactive 3D visualisations show products, systems or processes in states that are difficult to access in reality. Users can show or hide components, start processes, simulate fault scenarios or configure variants.
Added value is also generated during planning and training: teams examine scenarios together, identify interdependencies and test decisions before implementing them in reality at great cost. The Fraunhofer IGD also describes interactive visualisation as a tool that helps to weigh up different options in product development more quickly and communicate them transparently.
Which technologies make content interactive?
Technology
Suitable for
Typical interaction
Multitouch displays and tables
Product portfolios, maps, timelines, group presentations
Tap, zoom, rotate, move
Customised real-time 3D software
Machines, plant, digital twins, simulations
Change perspective, test different options, adjust parameters
Sensors and tracking
Interactive spaces, installations, contactless applications
Approaching, walking, pointing, gestures
Interactive projection
Walls, floors, models and large surfaces
Touch, move, change position
Media walls and LED screens
Remote access, data rooms, group presentations
Control via touchscreen, tablet or sensors
VR and AR
Spatial planning, training, products that are difficult to access
Dive in, settle in, explore
Content Management System
Ongoing maintenance and updating
Manage content, languages and media yourself
Interfaces and real-time data
Monitoring, simulation, live dashboards
Filter data, track statuses, trigger scenarios
Our multi-touch software is tailored to specific content, target audiences and usage scenarios. For large areas, for example, we combine it with interactive projections or create a fully immersive space.
Interactive visualisation in practice
Zeemobase: The energy transition as an interconnected system
Dieser Inhalt wird von einem Drittanbieter gehostet. Durch das Anzeigen des externen Inhalts akzeptieren Sie die Nutzungsbedingungen von youtube.com.
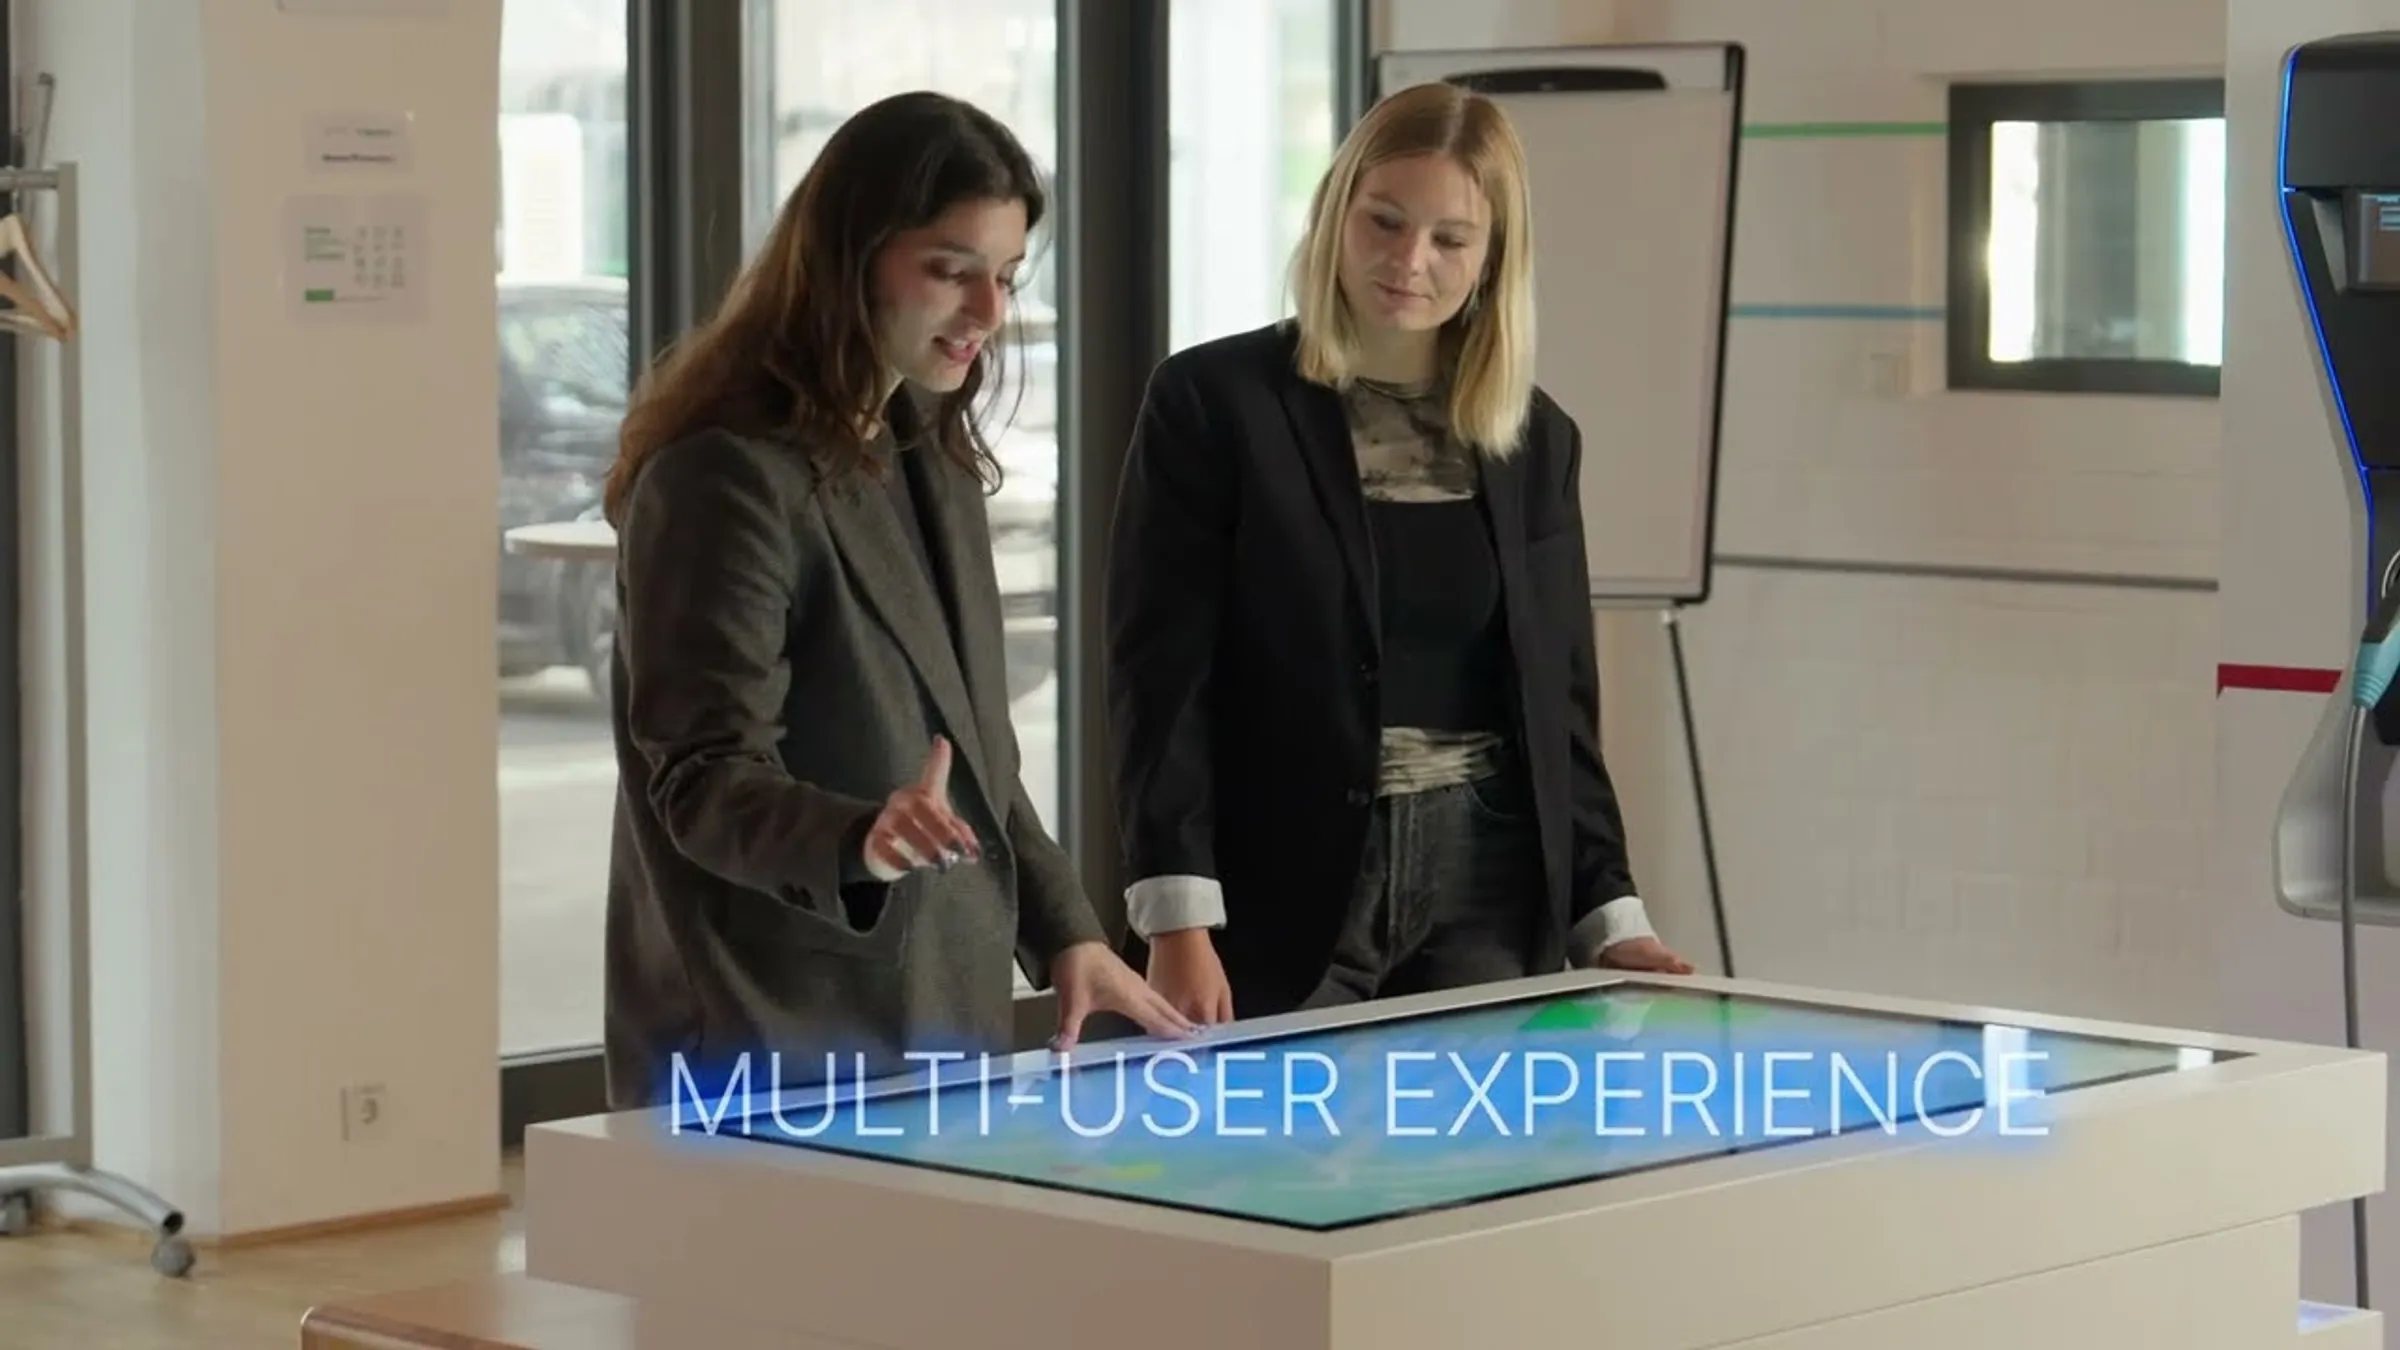
How can energy generation, grids, mobility and urban development be explained together? In the Zeemobase Showroom on the EUREF Campus in Berlin, a 3D real-time application simulates a connected city. Groups of visitors can adjust parameters and see how their decisions affect emissions, energy storage, charging infrastructure or transport networks.
The interactive visualisation does not reduce the issue to a simple ‘if-then’ scenario. It highlights knock-on effects and conflicting objectives – thereby providing a basis for facilitated discussions. About the Zeemobase project.
Braunschweig University of Technology: Factory planning at a multi-touch table
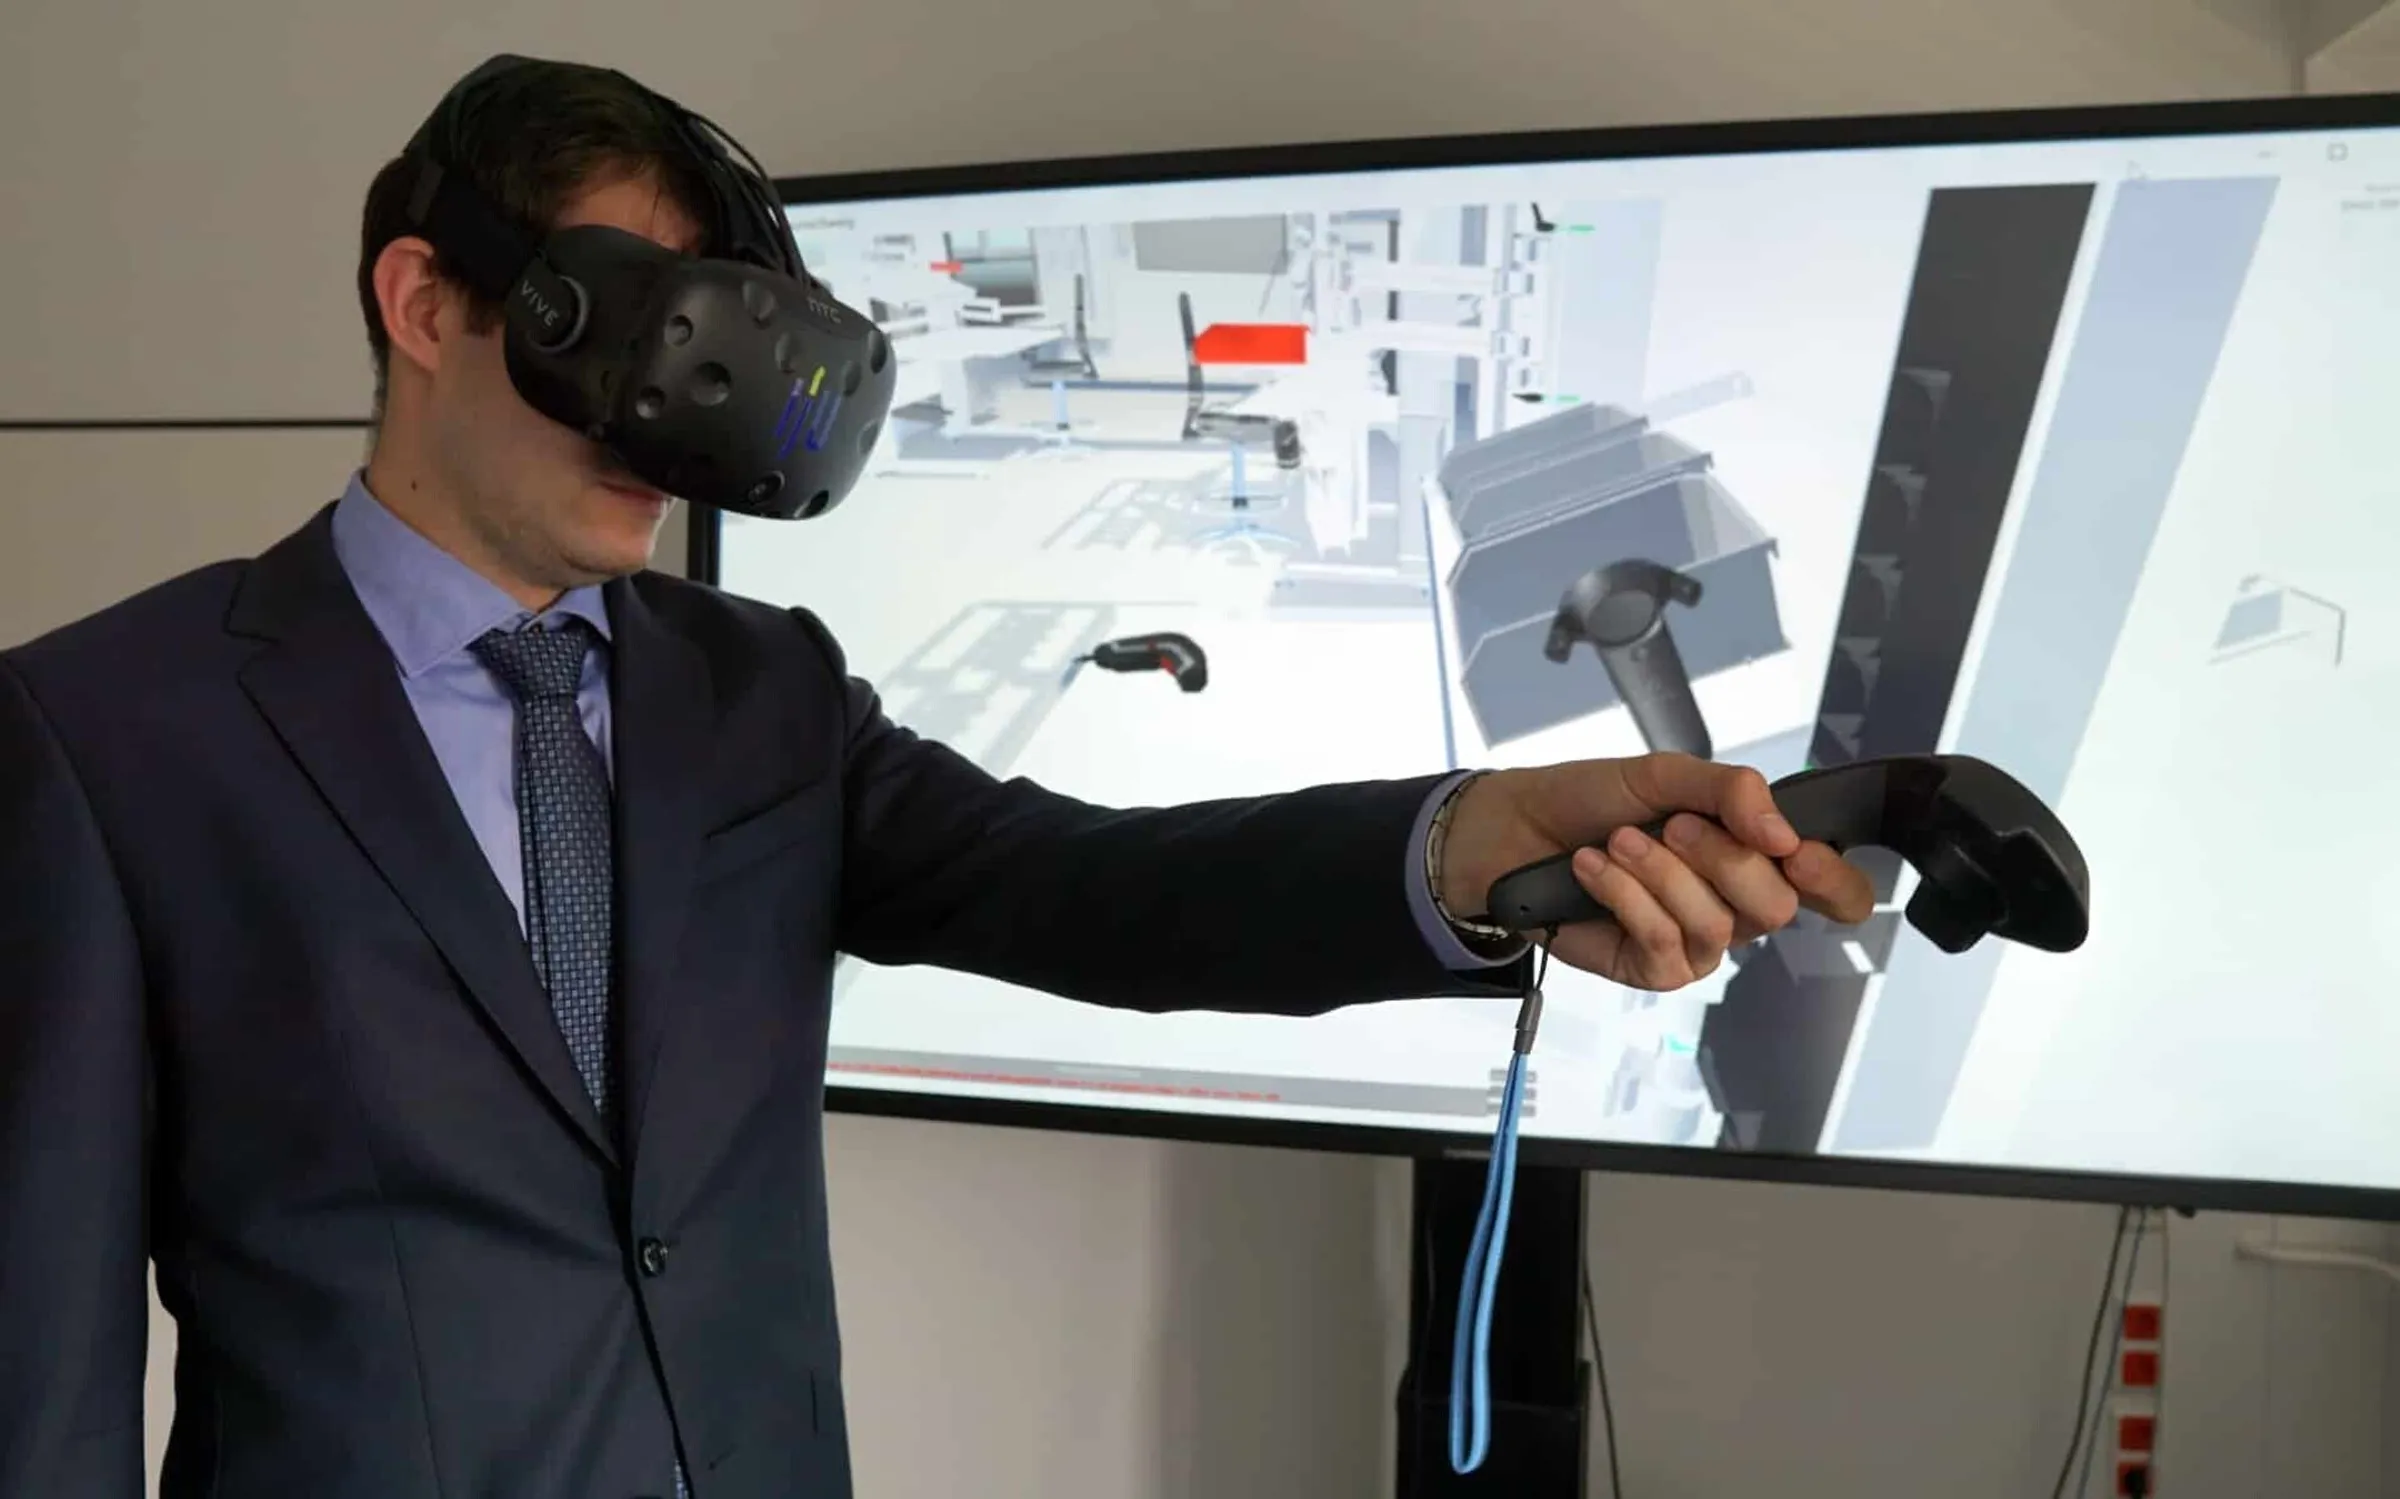
A collaborative multi-touch application for factory planning has been developed for the Technical University of Braunschweig. It enables several people to position machines as 3D models, plan material flows and take walking routes or safety distances into account. At the same time, performance data is visualised. Via a real-time connection, the planned factory can also be accessed and edited in virtual reality.
This transforms abstract planning into a model that can be modified collaboratively. Towards interactive factory planning.
House of Business: Global connectivity in the region
Dieser Inhalt wird von einem Drittanbieter gehostet. Durch das Anzeigen des externen Inhalts akzeptieren Sie die Nutzungsbedingungen von youtube.com.
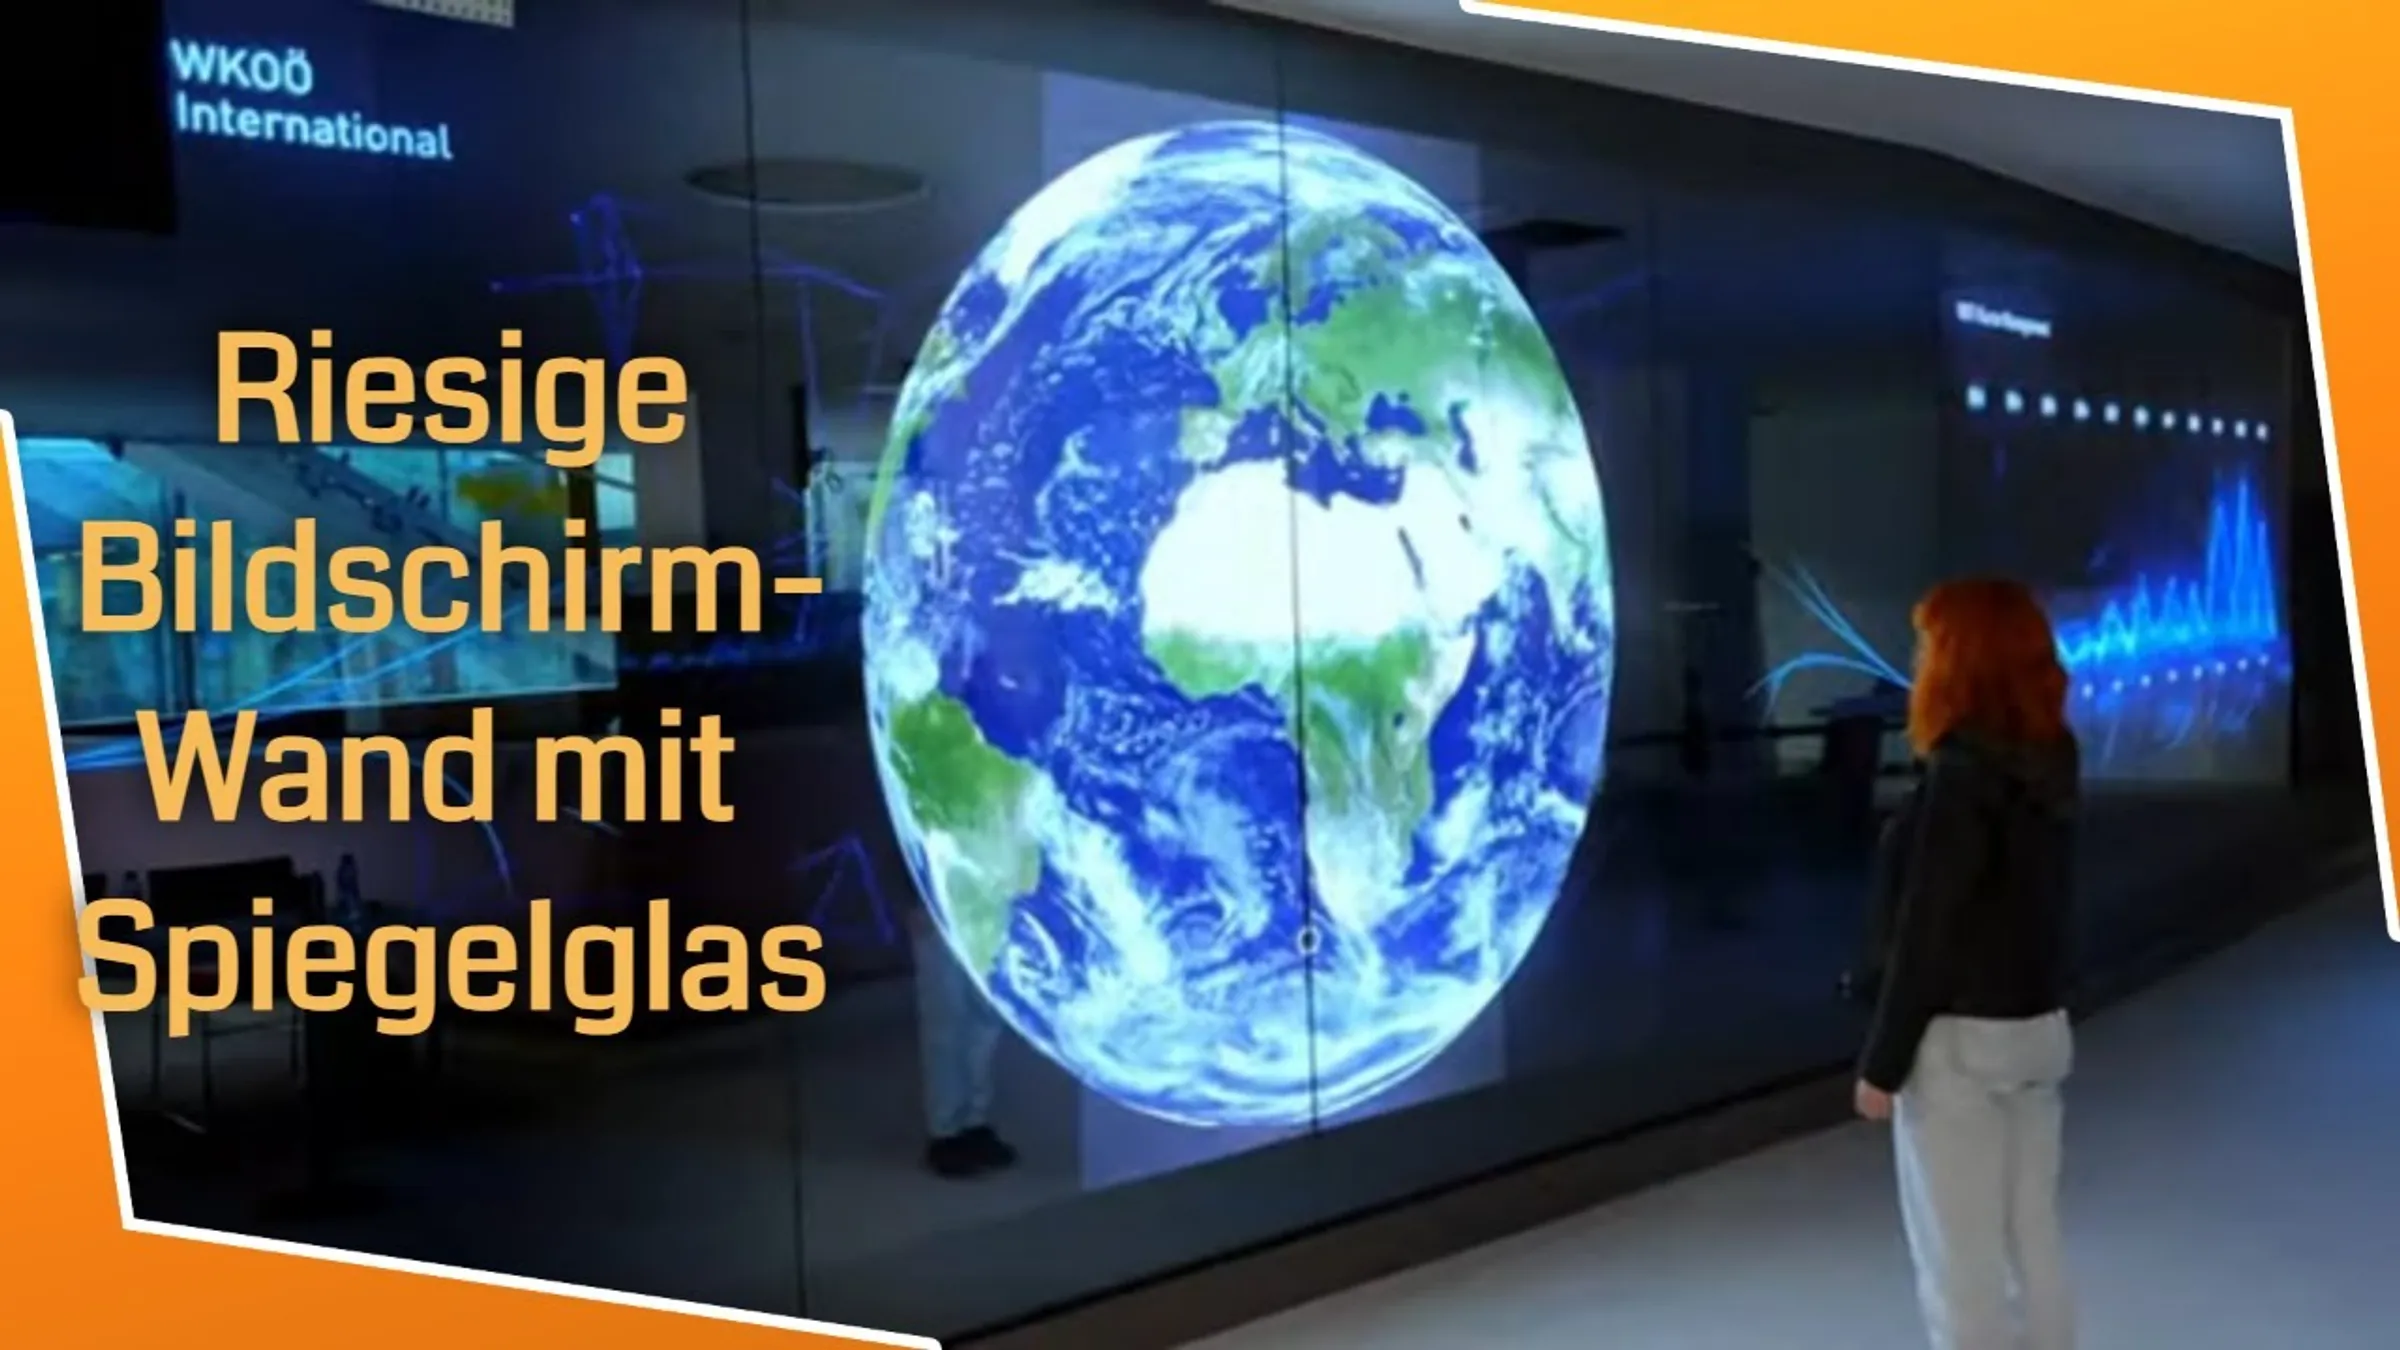
At the Haus der Wirtschaft Oberösterreich, a multimedia installation combines 40 screens, mirrored glass and interactive elements. A world map reacts to the position of visitors within the room and displays the international network of foreign trade. At the same time, a transparent touchscreen allows visitors to explore a virtual tree, symbolising innovation.
Here, the interactive visualisation does not serve as a standalone exhibit. It becomes part of the architecture and the flow of movement within the space. About the Haus der Wirtschaft.
You can find further examples in our projects for brands, products and spaces.
From the initial idea to an interactive presentation system
An interactive visualisation always begins with a question: what should the audience have understood, felt or done by the end of the experience?
1. Concept & Experience Strategy
We analyse target audiences, content, usage scenarios and communication objectives. This results in a clear guiding principle for design, interaction and space. Early-stage visualisations and technical planning provide a robust basis for decision-making.
2. Interactive Space Design
We translate content into a spatial visitor journey. In doing so, we ensure that media, interfaces, exhibits and architecture are clearly positioned. As a result, the installation does not appear to be technology retrofitted into the space, but rather a cohesive experience.
3. Experience Logic & Software
We develop user flows, interaction principles, real-time graphics, control systems and content management. The software responds to people, objects or data – reliably, quickly and in line with the corporate design.
4. Hardware & System Integration
Displays, projections, sensor technology, lighting, audio and bespoke technical solutions are integrated into a fully functional system. We clarify interfaces and responsibilities at an early stage to ensure there are no nasty surprises on the guest list when it comes to setting up.
5. Implementation & Operation
Following testing, fine-tuning and commissioning, we will train your team. Content can be updated via a content management system (CMS). Maintenance, monitoring and support ensure reliable operation.
You can find out more about our process under ‘Services: from concept to operation’.
What makes a good interactive visualisation
The first interaction is immediately clear
An interface must show what is possible. A clear starting point, visible feedback and consistent responses ensure that visitors do not find themselves standing in front of an impressive installation without understanding how to interact with it.
In-depth content on demand
The key message should be clear without the need for instructions. Details are provided in accordance with the principle of ‘an overview first, followed by more in-depth information for those interested’. This ensures that brief encounters are just as meaningful as longer technical discussions.
Interaction serves a substantive purpose
Rotating, zooming and swiping are not ends in themselves. Every action should answer a question, enable a comparison or change a perspective.
Groups can explore together
In showrooms and brand experiences, interaction is often a shared experience. A group of visitors should be able to interact together. To achieve this, sightlines, font sizes, operating height, response times and multi-user capability must be planned for the physical space.
Accessibility is taken into account from the outset
Contrast, clear labelling, alternative access methods and text equivalents for complex graphics improve accessibility. The W3C’s Web Content Accessibility Guidelines provide a reliable basis for this, for example regarding the use of colour and text alternatives for complex images.
Content remains up to date
An interactive visualisation is only valuable in the long term if your team can update the content themselves. A suitable CMS, data sources and modularly developed software ensure that the application does not become a digital fossil over time once it has been published. Physical products should also be replaceable at a reasonable cost.
Cost, time and scope: what determines the effort involved
A reliable cost estimate cannot be based solely on the cost of hardware and technology. The following questions are particularly crucial in determining the scope of the project:
- What are the target groups and usage scenarios?
- Do any content, 3D models or animations need to be recreated?
- Will live data or existing systems be integrated?
- Which haptic products or demonstrators should be exhibited?
- What are the floor areas, lighting conditions and building specifications?
- What are the requirements for CMS, monitoring, maintenance and support?
A well-thought-out concept distinguishes between essential functions and nice-to-have features. This provides cost certainty and helps to achieve the best possible impact within the available budget. When developing concepts for interactive exhibitions, we clarify the objectives, interaction logic, technology, content and timetable – and, above all, the costs – before implementation begins.
Frequently asked questions about interactive visualisation
What is an interactive visualisation?
An interactive visualisation is a visual representation that responds immediately to user input. Users can, for example, alter the content using touch, gestures, movement, objects or data filters, thereby exploring relationships for themselves.
What sort of content is suitable for interactive visualisation?
Complex products, processes, data and innovations are particularly well suited to this approach. Content that needs to be adapted for different target audiences or languages also benefits from an interactive presentation.
What is the difference between animation and interactive visualisation?
An animation follows a predetermined sequence. In an interactive visualisation, the audience influences the choices, perspective, level of detail or progression. This creates a personalised experience rather than a linear one.
What technologies can be used?
Options include, amongst others, multi-touch displays, real-time 3D software, sensor technology, projections, media walls, VR and AR, as well as physical markers and interfaces to live data. The technology used depends on the content, target audience, venue and usage scenario.
Can existing data and systems be integrated?
Yes, depending on the project, databases, APIs, sensors, product data or other systems can be integrated via interfaces. Before implementation, the data quality, update frequency, security and the desired responses are clarified.
How can content be updated at a later date?
A project-specific content management system enables users to update text, images, videos, languages or data records independently. Which sections can be edited is determined in accordance with editorial workflows.
How long will the implementation take?
The duration depends on various factors: concept, content, scope of the software, hardware, premises and coordination processes. Based on a structured requirements analysis, a realistic timetable with clear milestones can then be drawn up.